The Mapping Ambient Vulnerabilities project uses Critical Spatial Data Science methods and approaches to develop new spatial data and indicators. The Project Team was lucky enough to work with the team at Methods for Change, an ESRC project that showcases the diverse range of methods applied across the social sciences, to help explain the approach.
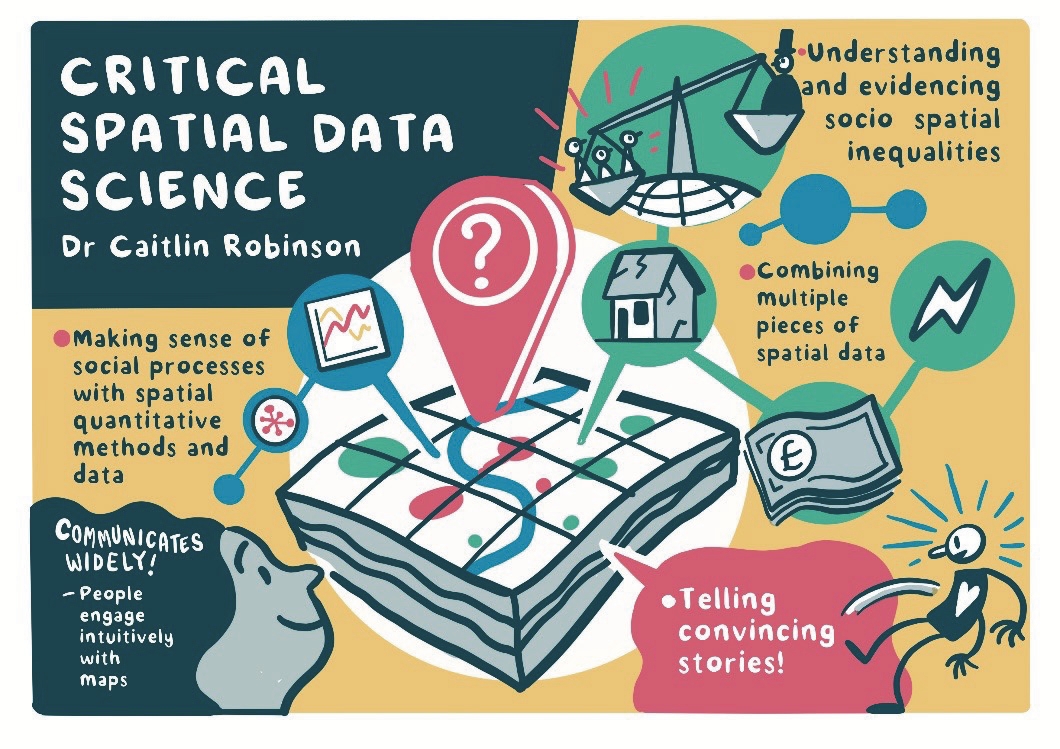
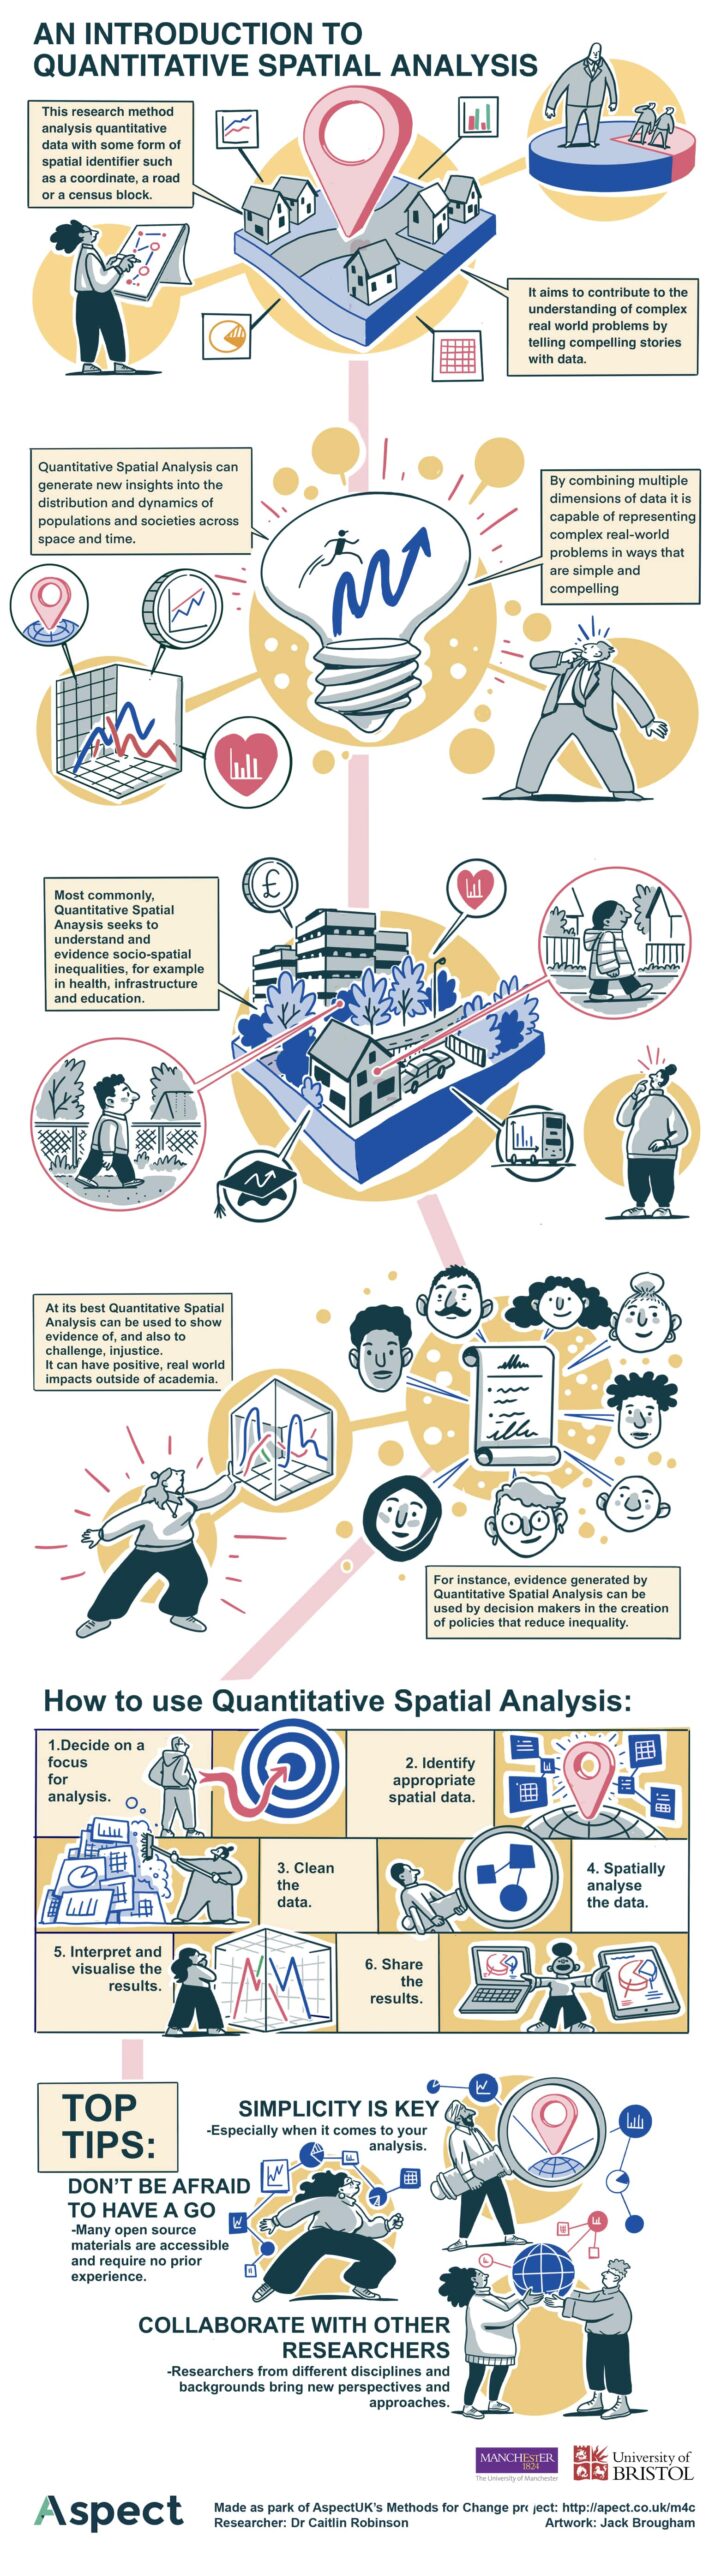
What do we mean by Critical Spatial Data Science? Critical Spatial Data Science (or Geographic Data Science) analyses quantitative data with some form of spatial identifier – for example, a coordinate, a street name, or a census block – to generate new knowledge. When analysing spatial data, a critical analysis is typically underpinned by theories that help us to understand, and therefore to best represent complex real-world processes.
How can we apply Critical Spatial Data Science? Critical Spatial Data Science has wide-ranging applications with the potential to provide new insights into the distribution and dynamics of populations and societies across space and time. However, most commonly it seeks to understand and evidence socio-spatial inequalities, for example, inequalities in health, infrastructure, or education.
Why might I want to use Critical Spatial Data Science?
To evidence socio-spatial inequalities. For Elizabeth Delmelle, Critical Spatial Data Science has the potential to make a “substantial imprint on some of society’s more arduous problems” – whether that be evidencing the uneven distribution of urban heat amongst populations, or place-based health inequalities that accumulate over the course of a lifetime.
To learn about social processes at scale. Critical Spatial Data Science is a powerful way of extrapolating the detailed insights and knowledge derived from qualitative research, at scales that would otherwise be timely and costly to achieve, for example, across cities globally or analysing change over decades.
To combine multiple dimensions. Societies are inherently complex and there are often a wide range of dimensions that are important to represent. Spatial data science approaches can combine and analyse a myriad of different pieces of data simultaneously – social, demographic, economic, infrastructural, or political – to provide new insights and information.
To tell a convincing story with data. Mapping spatial data in new ways is a powerful way of conveying complex information that many people find intuitive to interpret. New and interactive ways of visualising spatial data can be useful, including interactive dashboards or story-maps.
Learn more about the approach, as well as examples of how it can be applied, in the accompanying How-to Guide. The team also created a beautiful illustration that provides an overview of the approach.
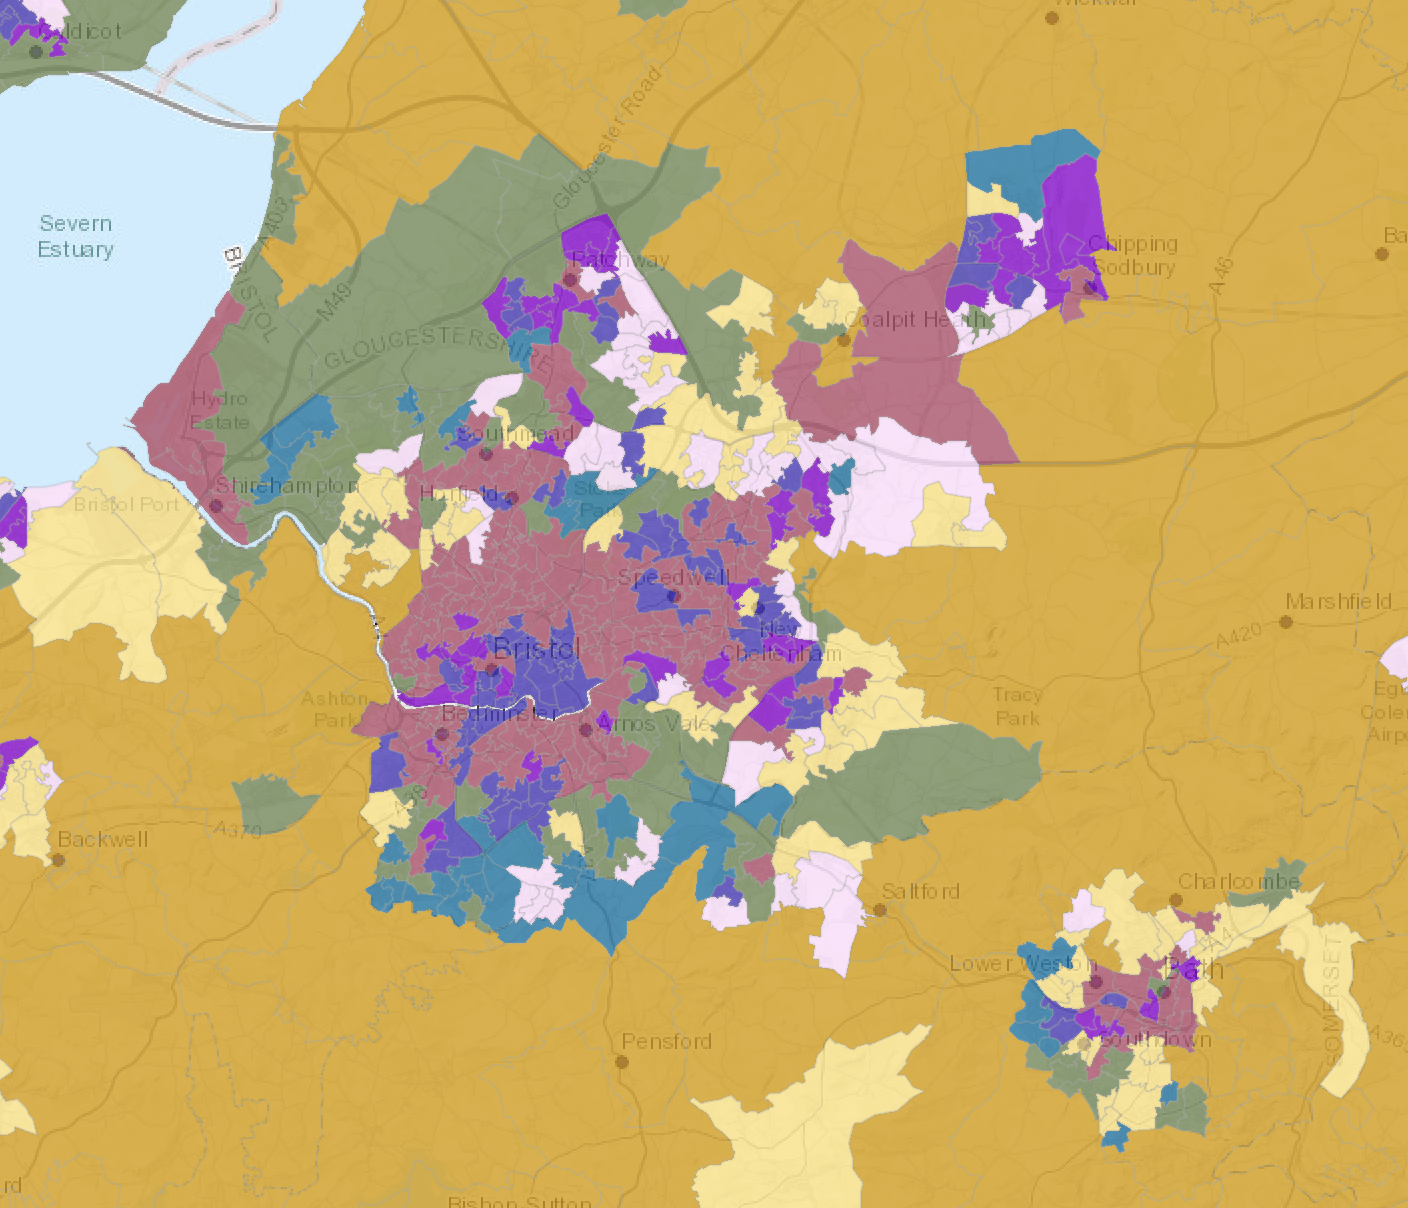
During the event, we shared our interactive maps that show which indoor air pollution sources are most influential in different neighbourhoods. We also discussed the key data and policy limitations that are currently slowing…
This one day workshop aims to improve our collective understanding of air, energy and climate vulnerabilities, and their uneven distribution both socially and spatially. We are especially interested in the…